Research Visualizations
Key findings from our comprehensive exploratory data analysis
TAM AIR Club × CAL FIRE × UCSF × UCI
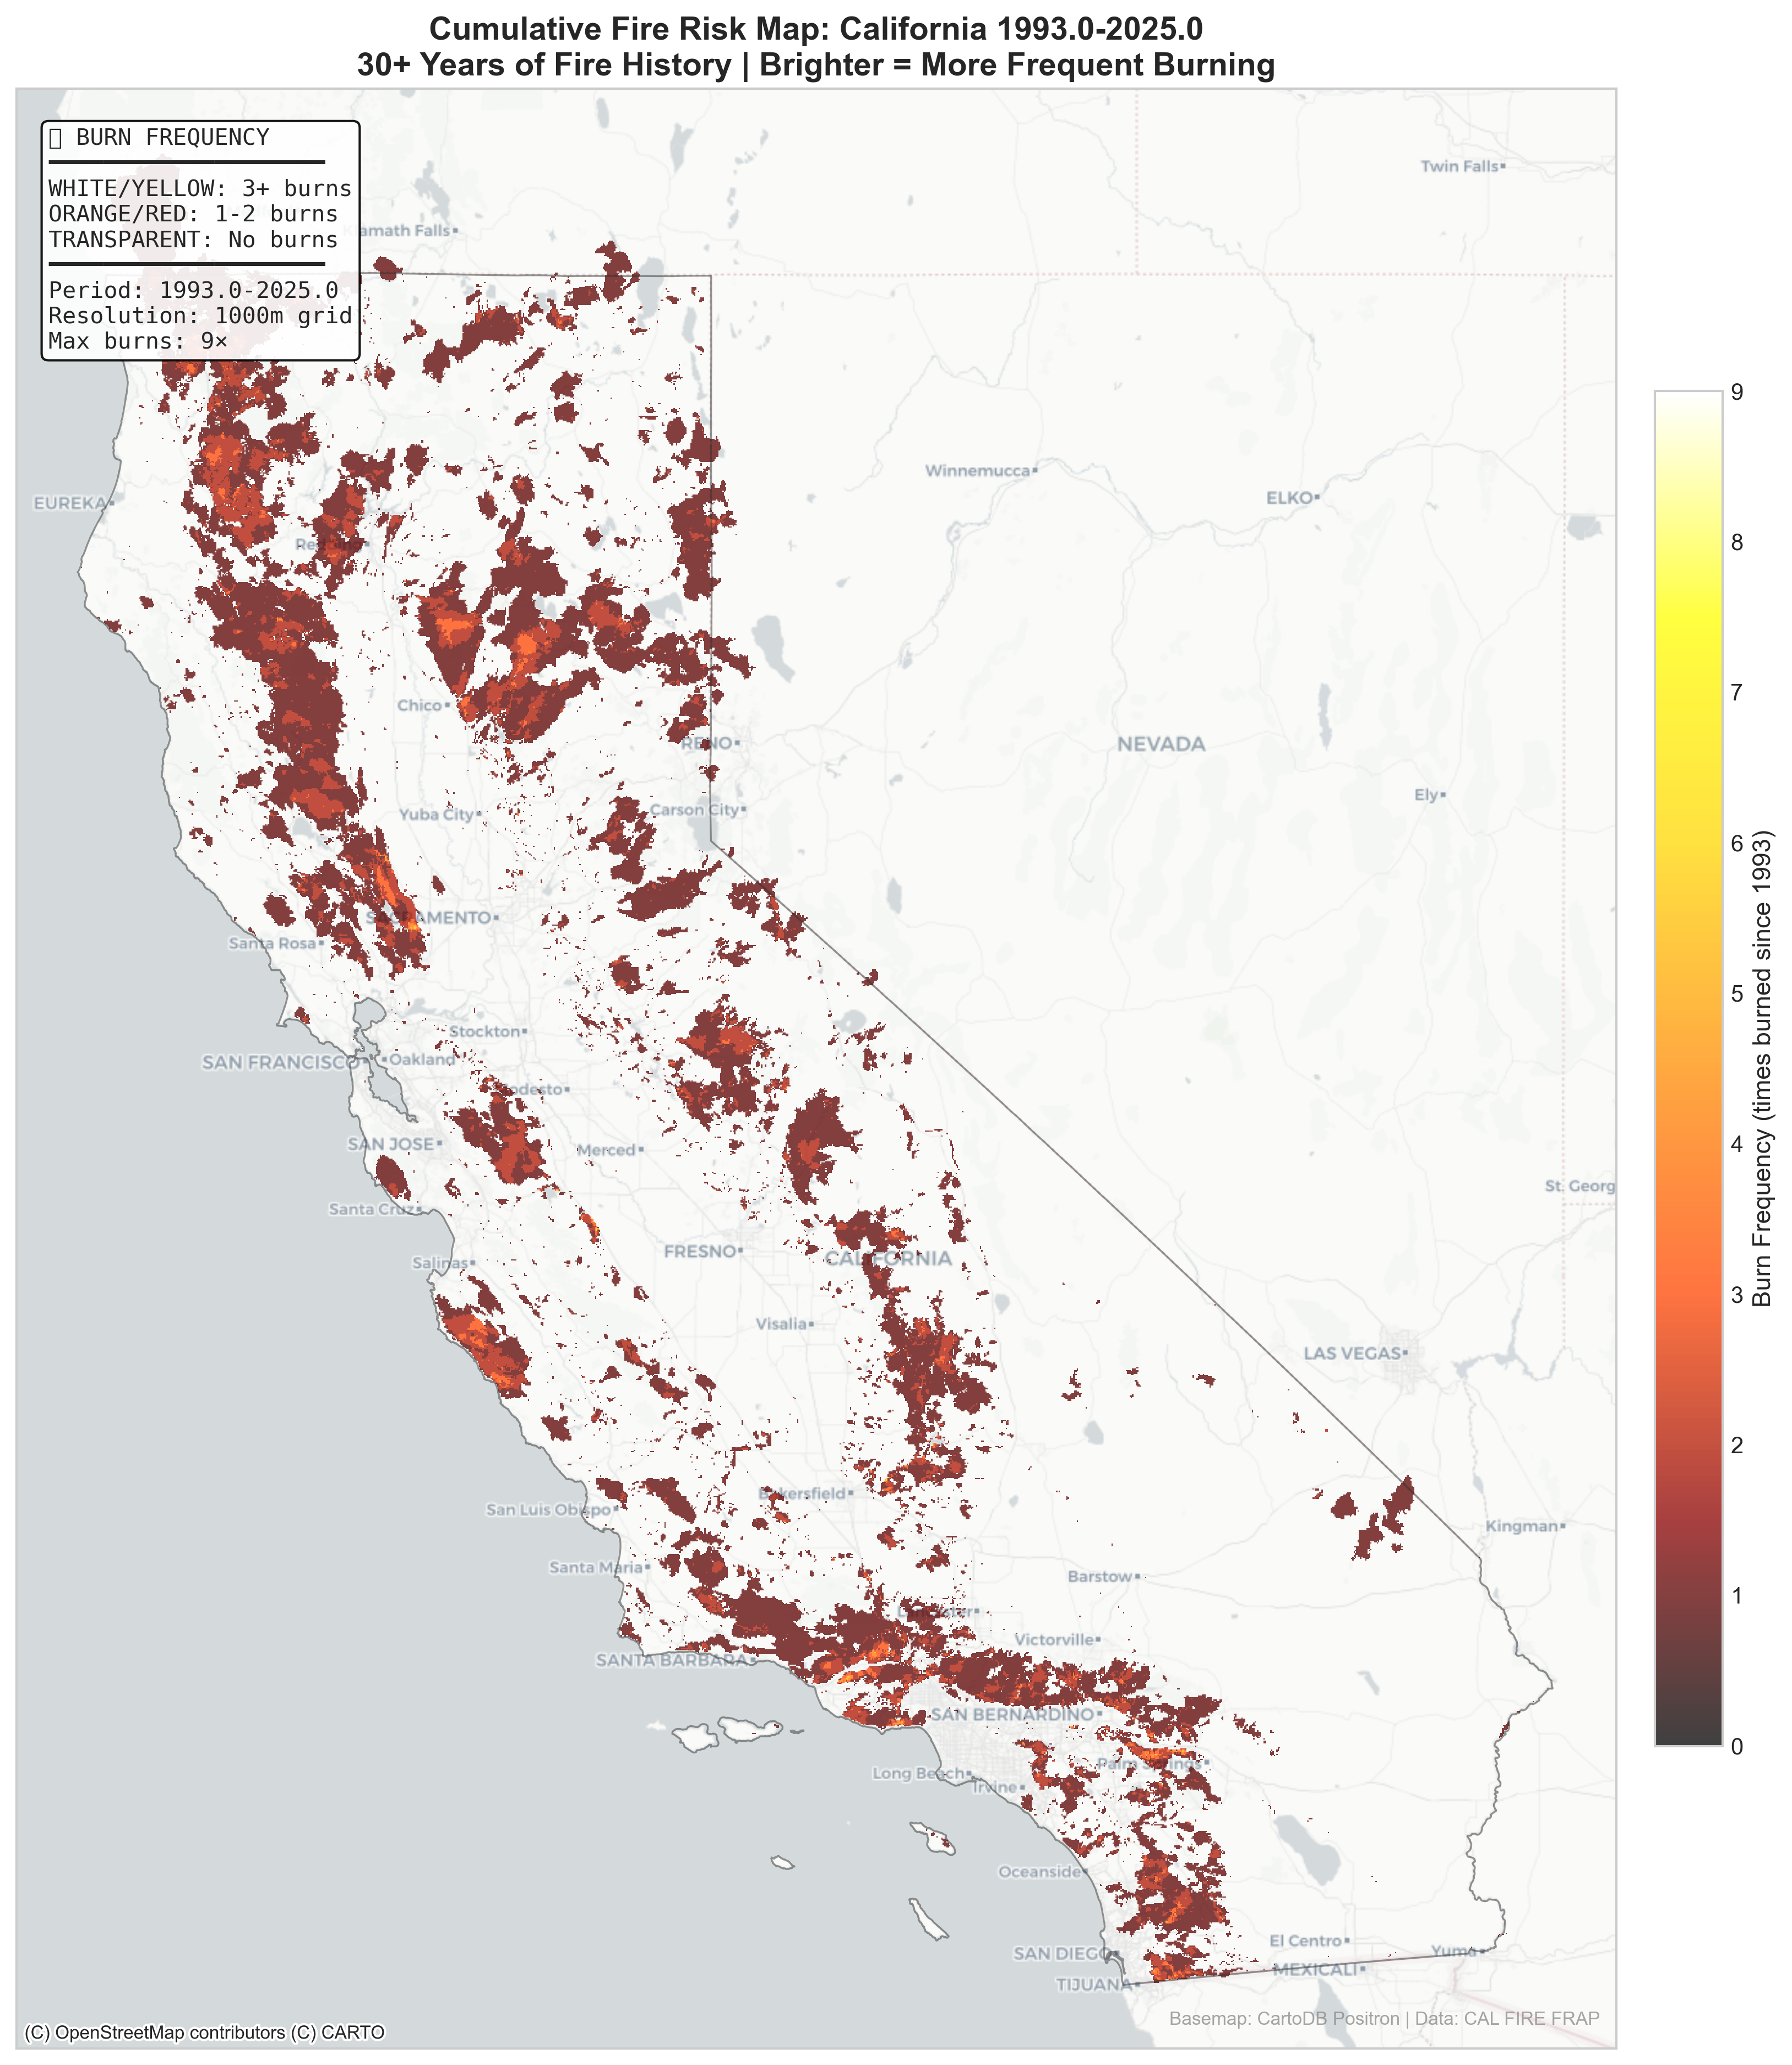
Our research initiative aims to build a pixel-wise wildfire risk prediction system for California at 800m × 800m resolution using machine learning. By analyzing over 147 years of fire perimeter data, we're developing tools to help predict and prevent catastrophic wildfires.
This collaboration brings together high school researchers, university academics, and California's fire management professionals to tackle one of the state's most pressing environmental challenges.
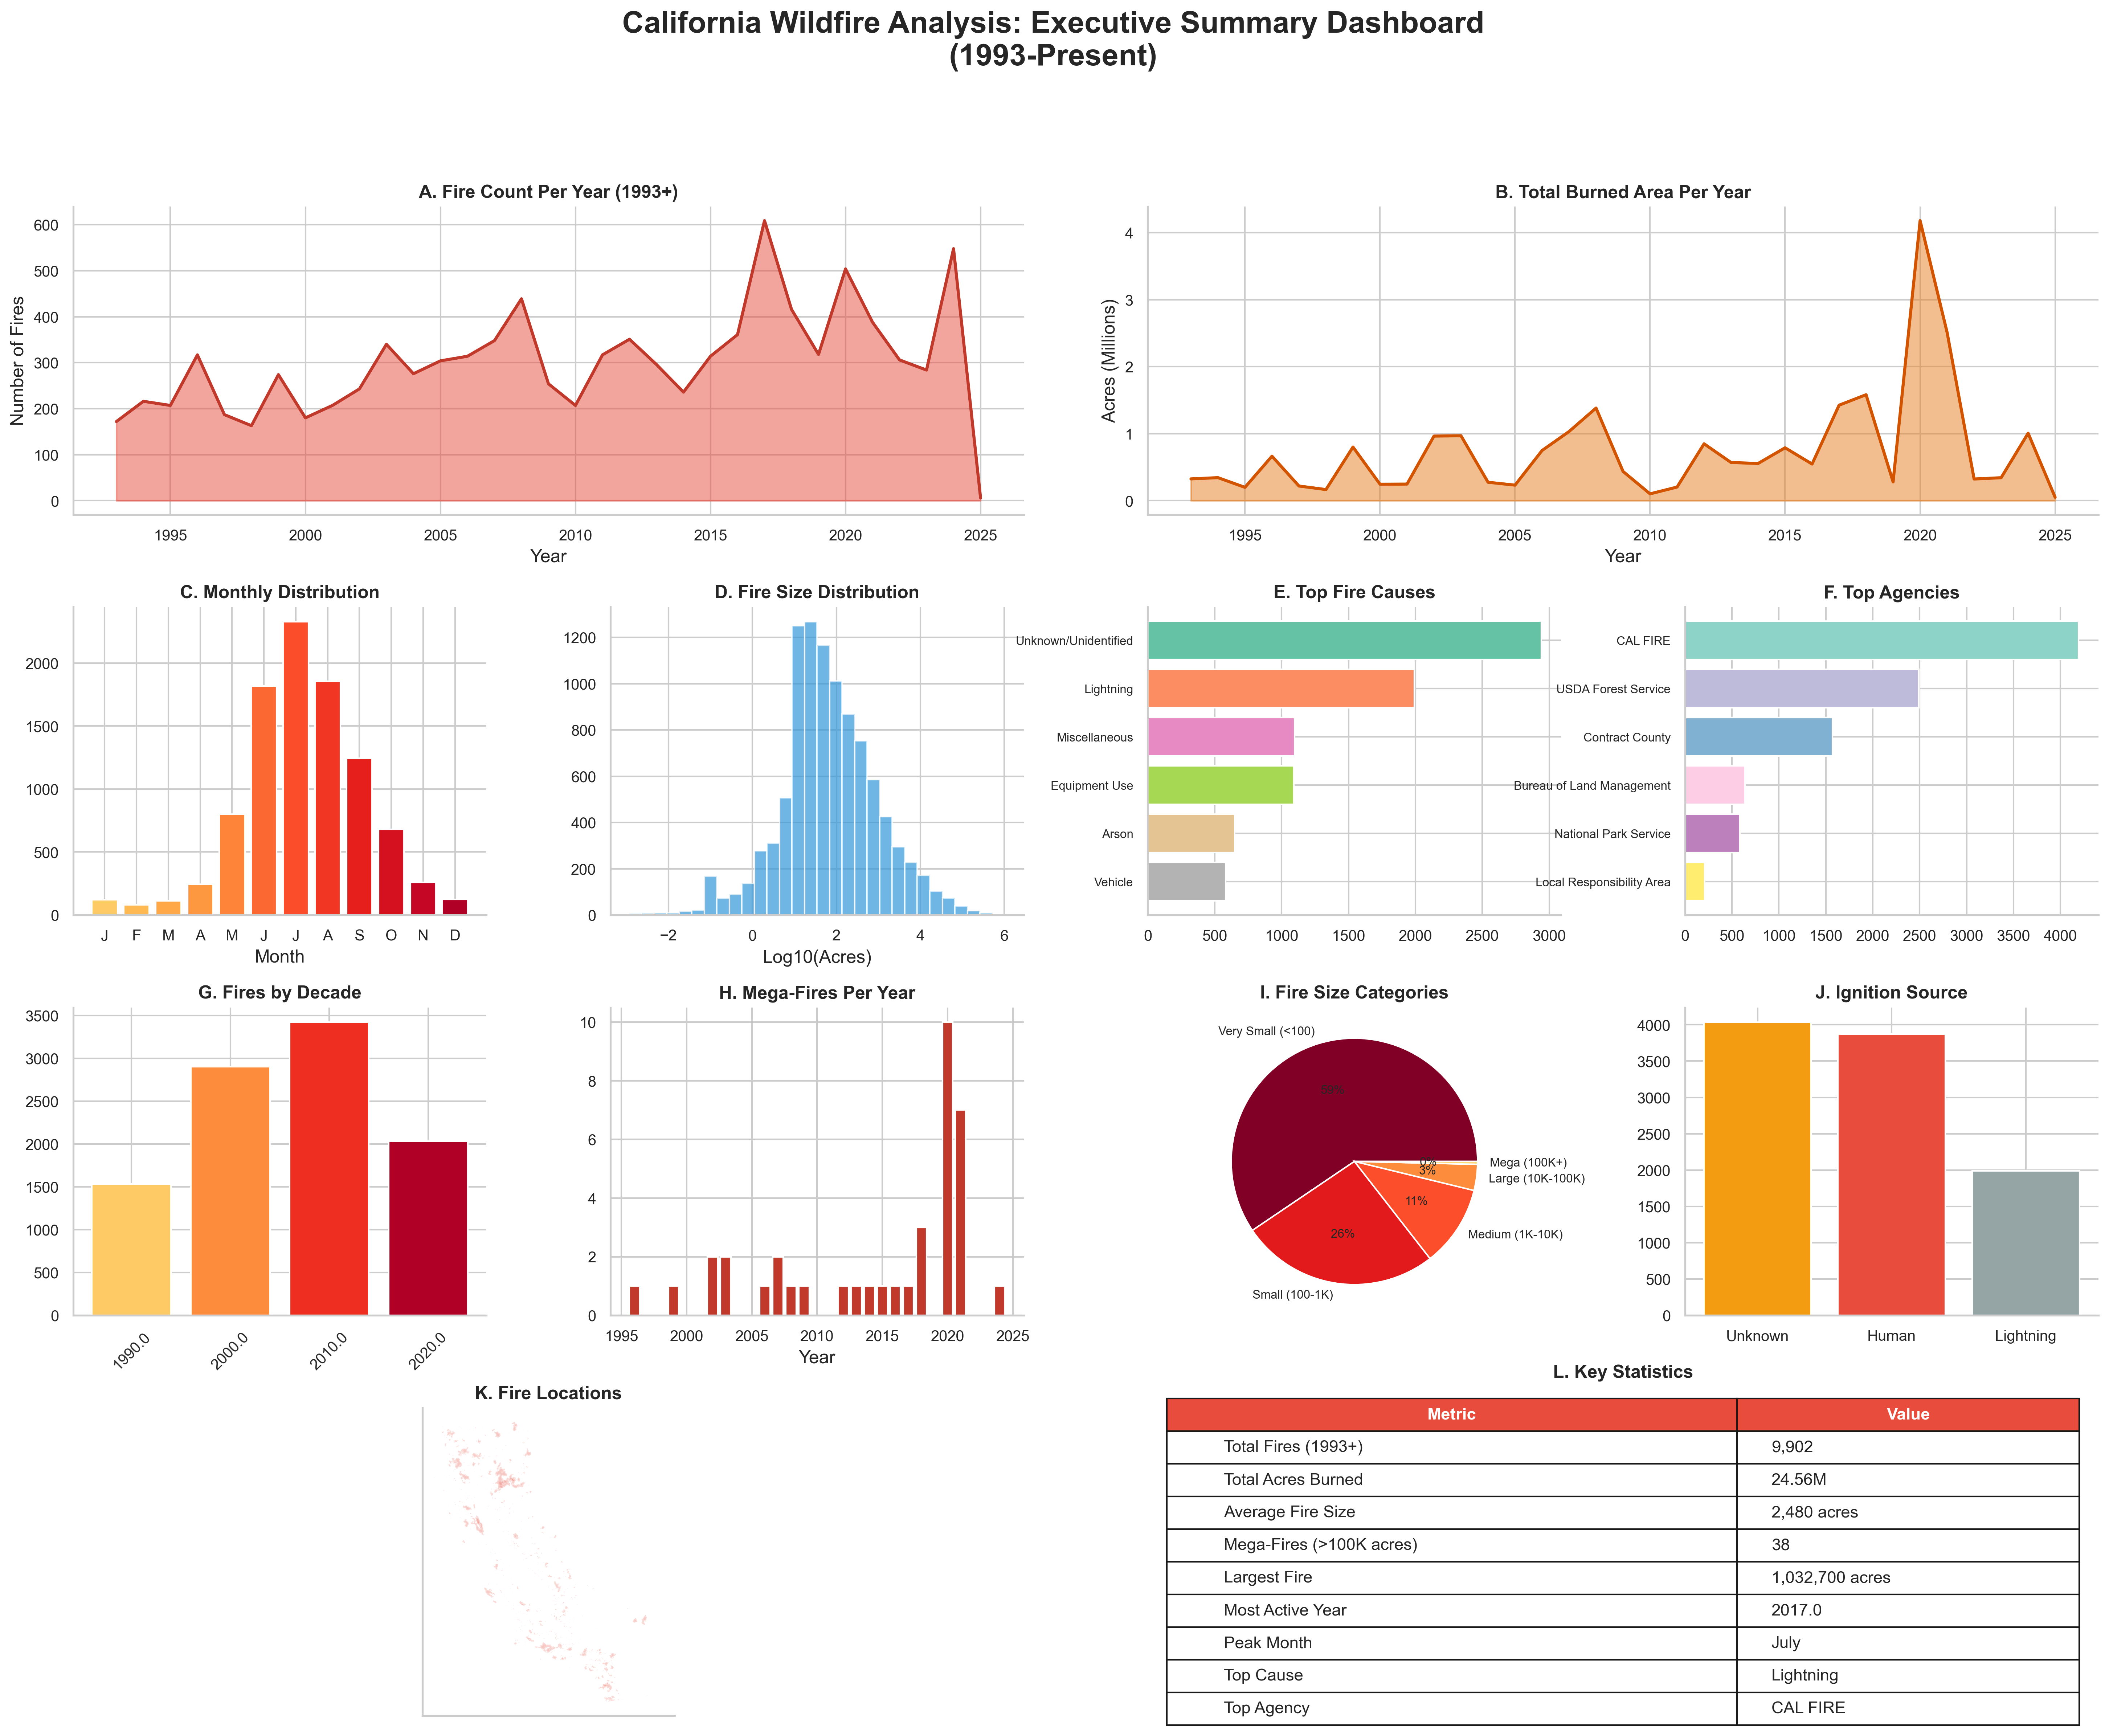
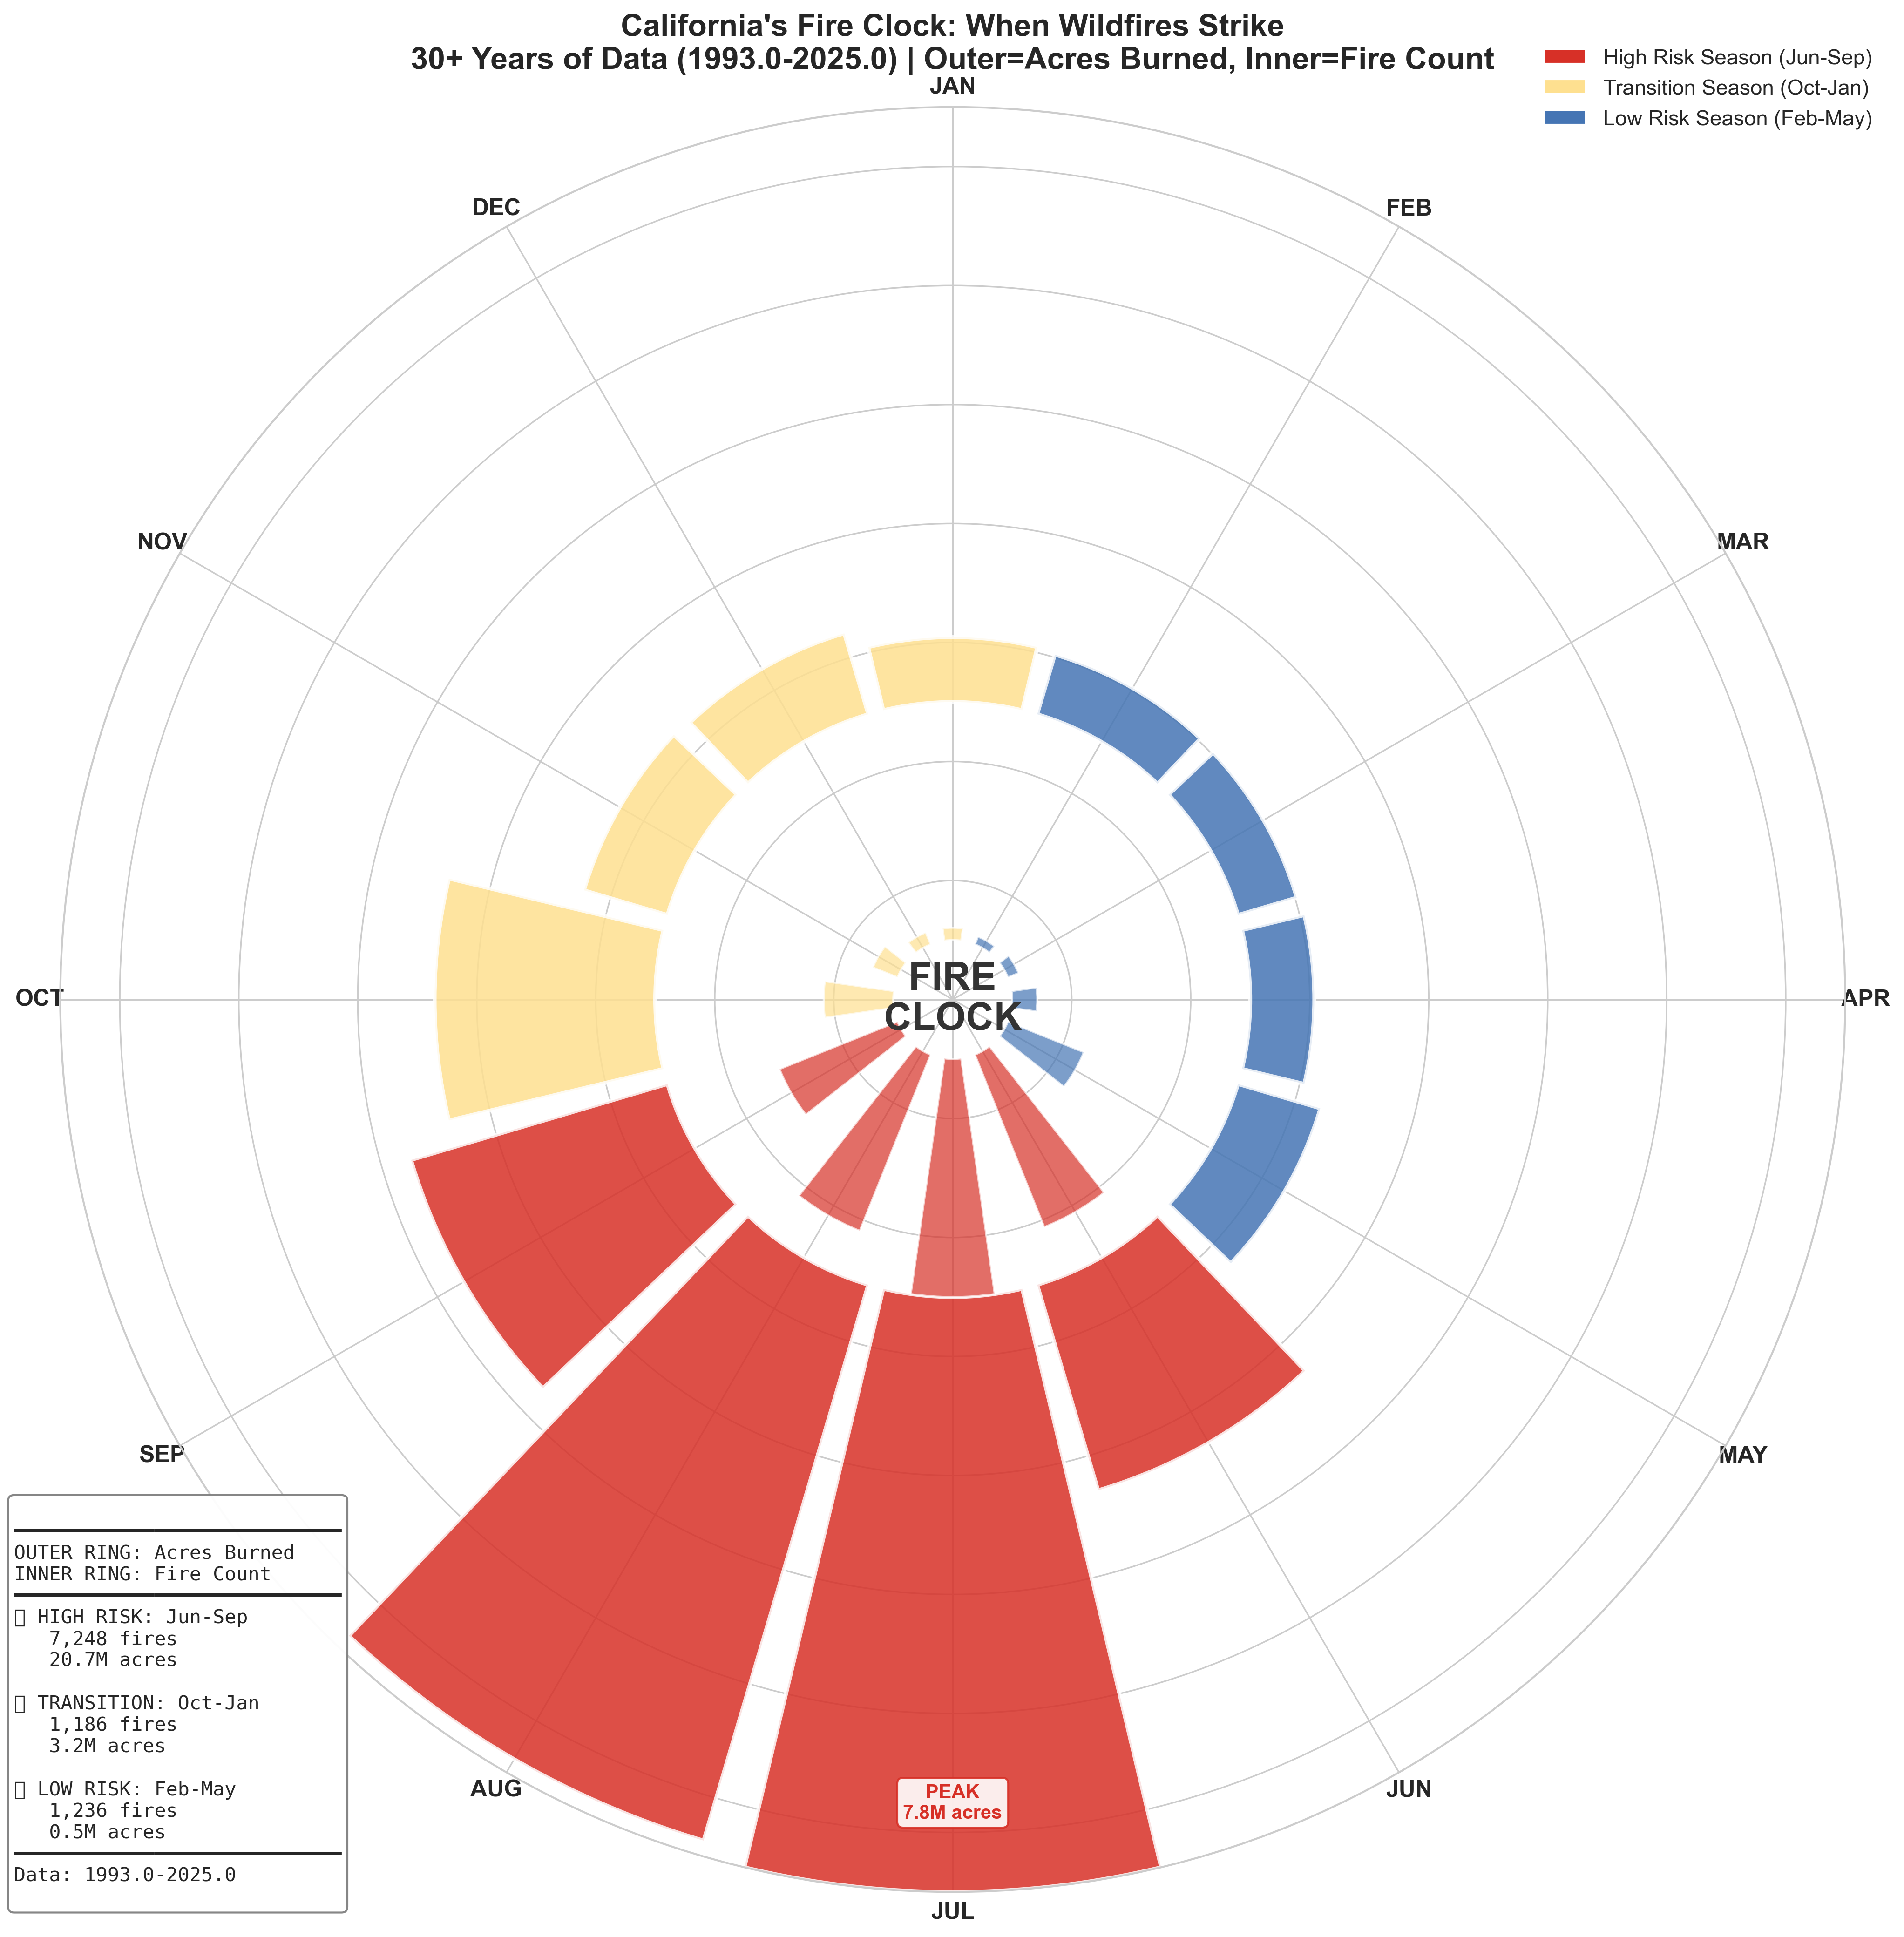
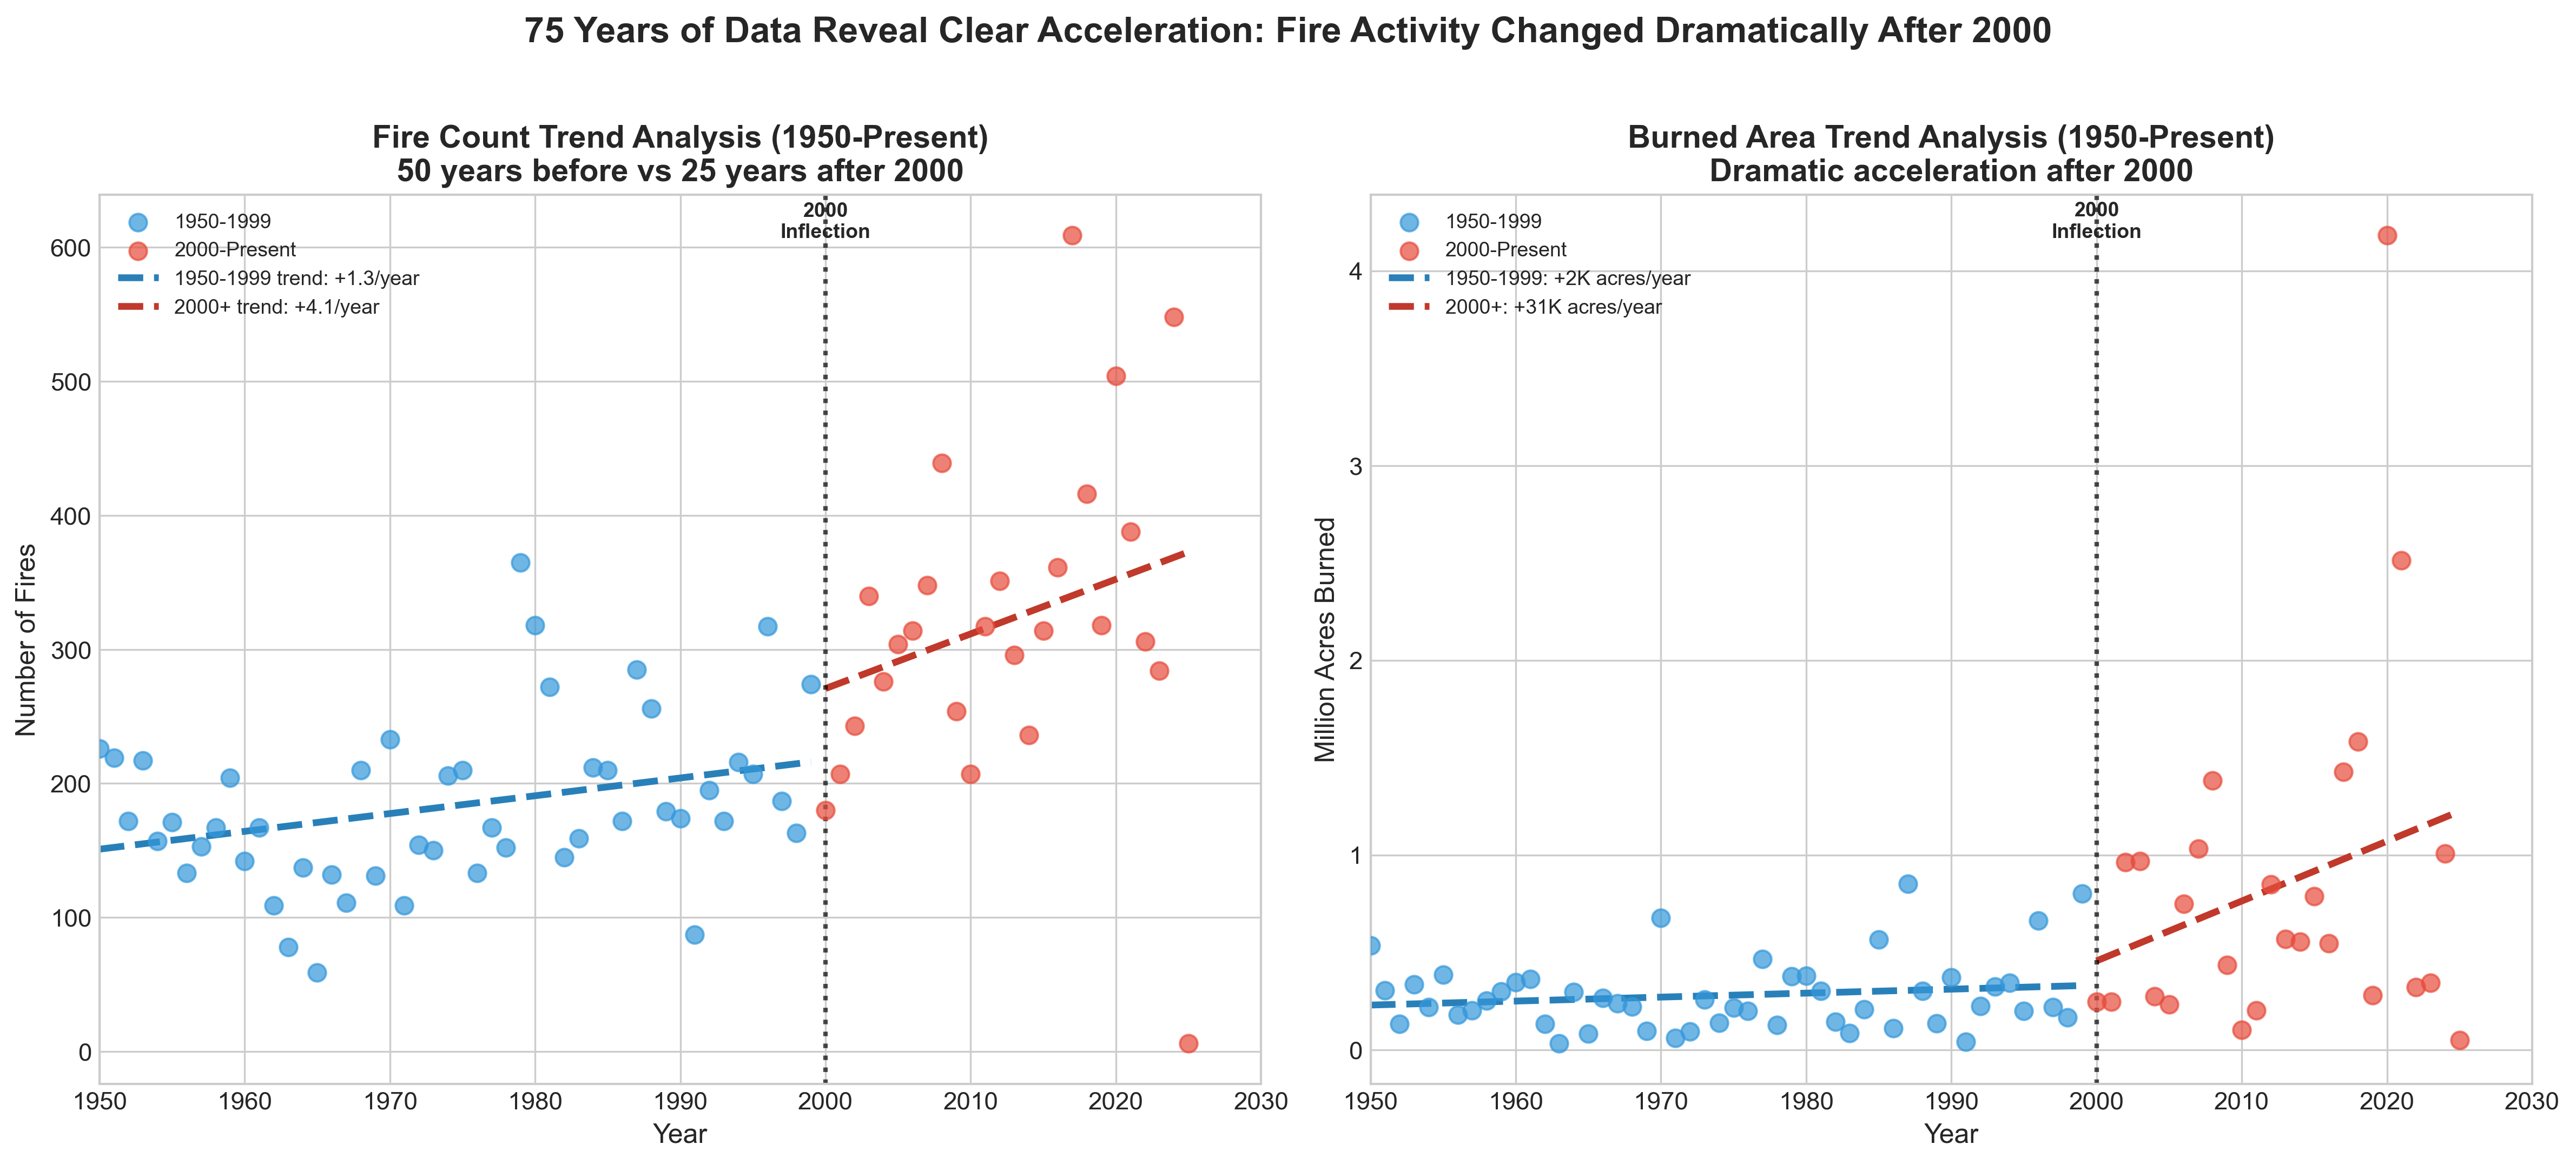
Critical insights from our exploratory data analysis
Acres burned in 2020 alone - California's worst fire year on record
Of burned acreage occurs during June-September fire season
Of fires cause 58% of all damage - extreme concentration of risk
Fires exceeding 100,000 acres recorded since 1993
Key findings from our comprehensive exploratory data analysis
Explore all 38 mega-fires (>100,000 acres) recorded since 1993
Click below to explore the full interactive map with all mega-fire perimeters, details, and filtering options.
Open Interactive MapNote: Large file (~35MB). Best viewed on desktop.
Download our comprehensive analysis report and explore the methodology
Complete exploratory data analysis with 19 high-resolution figures, statistical findings, and methodology documentation.
Download PDF (3.6 MB)View our analysis notebooks with full code, methodology explanations, and reproducible results using Python and GeoPandas.
View on GitHubOur multi-phase approach to building a wildfire prediction model
Comprehensive analysis of 22,000+ fire perimeters. Created 19 publication-quality visualizations. Identified key patterns and data quality thresholds.
Generate 800m × 800m pixel grid covering California. Rasterize fire perimeters to binary grid cells. Create temporal aggregation (monthly/seasonal).
Integrate PRISM climate data (temperature, precipitation, VPD), DEM for topography features, and vegetation/fuel data. Align all datasets to common grid.
Develop CNN/LSTM architecture for temporal prediction. Train on high-quality post-1993 data. Address class imbalance challenge (99% of pixels never burn).
This research is made possible through collaboration
Student-led research team from Tamalpais High School
California Department of Forestry and Fire Protection
University of California, San Francisco - Academic Partner
University of California, Irvine - Research Collaboration
Learn more about our other projects and how you can support our mission to protect California from wildfires.